The e-commerce market in the Philippines is worth $1.1 billion. Yet, nobody really knows how Filipinos shop online. Sure, there are a number of surveys on online habits, but these tend to be flawed because they are based on claimed usage vs actual behavior.
Any serious e-commerce entrepreneur needs to know this stuff. In my previous life at Procter & Gamble, where I worked on Safeguard, Olay & Whisper (yes, feminine care products. That’s a different story for a different post), this level of in-depth consumer knowledge was par for the course.
We had tons of data sources. AC Nielsen retail panels. TNS household panels. Trade data. Proprietary surveys. Internal databases of concept test results vs in-market results. Media buying data. Market mix models that use multivariate regression. Big corporate machinery stuff.
But when I started AVA, an online retail platform for fashion & design brands, our team didn’t have this luxury.
Now, you do.
For the past few years, we’ve gathered tons of data on the online habits of Filipino consumers. This is based on actual buying behavior. It can’t get any more empirical than this.
So whether you’re a young entrepreneur creating an online brand, or an established retailer getting into e-commerce for the first time, you won’t have to start blind like we did.

Tweetie de Leon and AVA partnered to launch a Kickstarter campaign to save the dying inabel fabric.
Our Methodology
This post primarily uses two sources. First, we analyzed our actual transaction data. Second, we conduct user surveys from time to time.
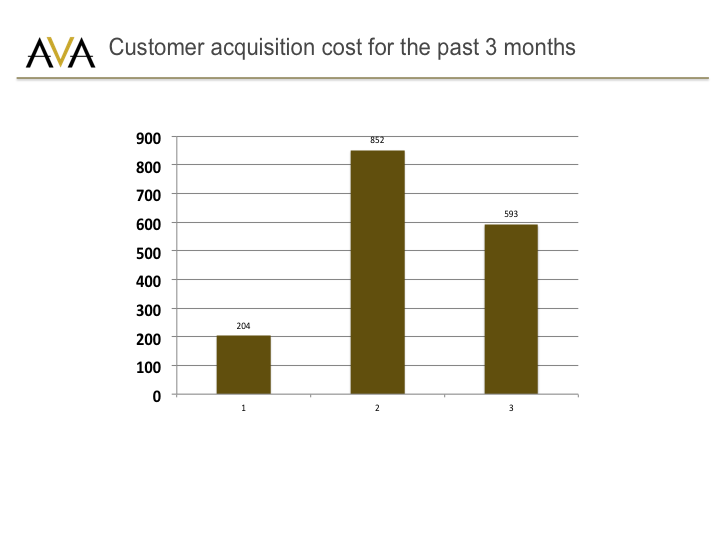
There are instances where we use multiple sources, of course. For instance, we combined our transaction data with our digital advertising spend to come up with our customer acquisition costs.
No data set will be completely representative, of course. So before you use our data to draw a few conclusions, a few caveats are in order:
- Positioning. AVA is positioned as a premium brand. Not necessarily luxury, but not mass market either.For instance, AVA will never carry brands like Bench or Penshoppe. Some people in the industry call this segment ‘masstige’ or ‘aspirational’. Our price points reflect this positioning, and therefore this is not representative of all Filipino consumers.
- Merchandising. We focus on brands that target women. In fact, 95% of our customers are female. Therefore we can’t make the same conclusions for male shoppers.
- Geography. We have admittedly focused our marketing efforts on Metro Manila. Therefore these observations won’t necessarily hold true for the entire Philippines.
So what are the top things we’ve learned?

Vania Romoff x AVA: http://ava.ph/shops/749-vania-romoff-for-ava.html
40% of purchases happen outside the mall hours of 10am to 9pm.
I like starting with this data point because it rebuts the general perception that Filipinos love their malls. This is one of those things that people say again and again that everyone has accepted it as conventional truth. Yet, I’ve never seen a cohesive body of data to support it. That close to half of purchases happen outside mall hours means that consumers see the value of shopping online.

Paypal and credit cards account for almost 80% of orders. 14% of orders are COD. This is of course a result of our target market. I’ve heard that in some sites, COD is up to 70% of orders. Credit cards are preferable in the long run because despite the bank charge, a site no longer has to worry about the logistical challenges of handling, collecting and reconciling cash orders.

Almost 80% of orders come from in Metro Manila. That’s not the interesting point for obvious reasons. What’s interesting is the long tail: though Cebu and Davao account for 4% of orders, there are other provinces that each have a share, such as Batangas, Cavite, Rizal, and Iloilo. This is happening even though we haven’t deliberately advertised to the provinces.

The implication here is that brands might consider targeted campaigns to tap the long tail of consumers in secondary cities.
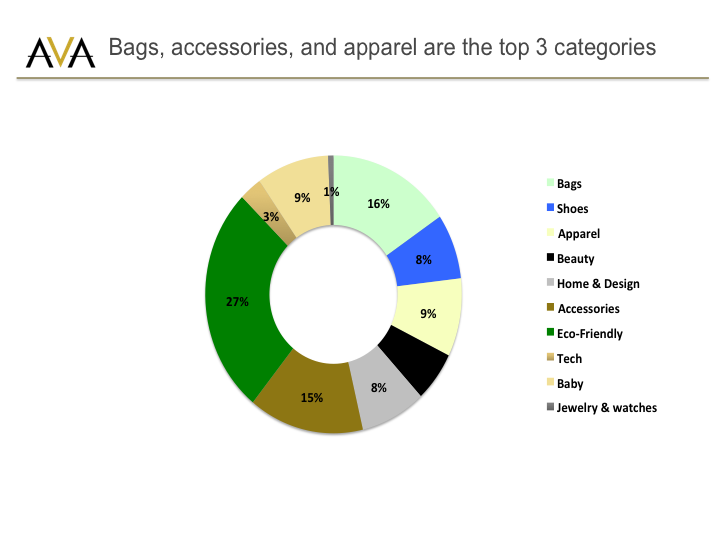
Bags (16% of orders), accessories (15%) and apparel (9%) are the top selling categories, accounting for 40% of orders. Eco-friendly is an internal, catchall term we use for products that have a sustainability or health angle, and consist mostly of accessories as well (like environmentally friendly yoga mats and home accessories).
On average, customers buy 1.96 items per order. To measure this, we simply divided the total # of individual items sold by the total # of customers for that month. Here, we took the past 6 months to have a broad view of buying behavior.

This is a pretty interesting point because it means that customers aren’t buying just one-off items. Online shopping is starting to mirror offline shopping habits in the sense that people are shopping multiple items in one basket. And this is just a discretionary product – fashion. I can imagine this will be higher for sites that sell groceries.
Customers spend on average P3,900 per order. As an average, this masks the range of purchases. For instance, the highest single order on the site was worth P129,000.00 (a luxury bag) and the highest spending customer has spent P306,000.00 over a one year period.

Yup, you saw that right. P300k on a website. From one customer. Awesomeness.
The averages also mask the importance of segments. For instance, the top quartile of our customers in terms of transaction value spend P7,300 per order (almost 2x the average) and account for 70% of sales value.
We also did a survey of customers (n=321 respondents).
With that, we found out that the among the most important shopping habits are: looking online to find brands consumers can’t find in the malls and to search for the best prices.

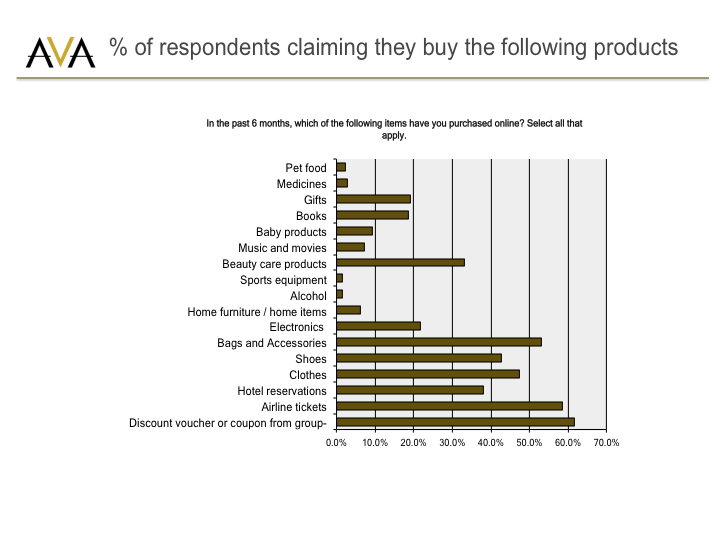
Among the other stuff people buy online include discount vouchers (60% bought in the past 6 months), airline tickets (58%), bags and accessories (53%), clothes (48%), and shoes (42%).
We also asked people who haven’t purchased why they haven’t. The top two barriers were price (60% of non-buyers. Probably not our market because we are not a mass market site), and sizing (40%).
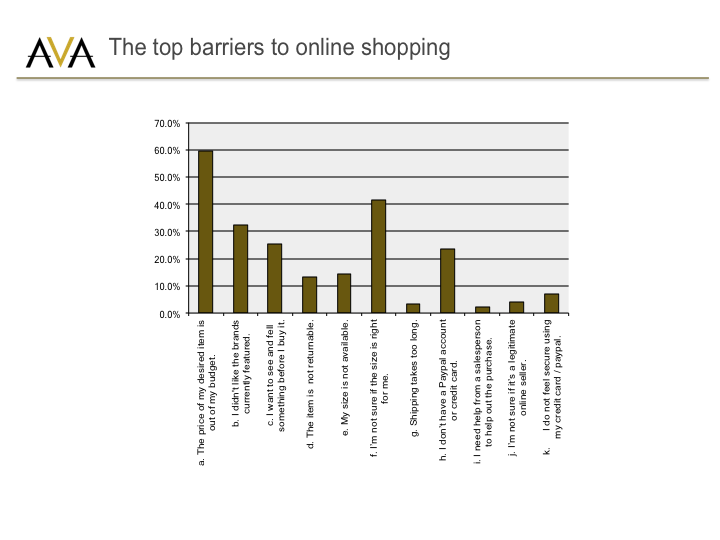
The fascinating point here is that only 1 out of 4 actually want to see and feel the items before they buy it. When most people express their skepticism for online shopping, this is one of the biggest concerns. But in reality, the vast majority don’t have this problem. And the 25% who want to see and feel are probably not our target market anyway. The biggest challenge of marketers is to find which customers to covet and which ones to ignore.
Ok, enough with surveys. Ok let’s go back to actual buying behavior.
Weekends don’t really count. The number of orders are above average during Thursdays and Fridays and below average during Saturdays and Sundays. This echoes what others have noticed about web traffic going down on weekends. Which kinda makes sense: people go out to the malls, meet friends, exercise, etc. In our case, the average age of the AVA shopper is 34, so she is likely a young mom and would thus have a busy weekend with the family.
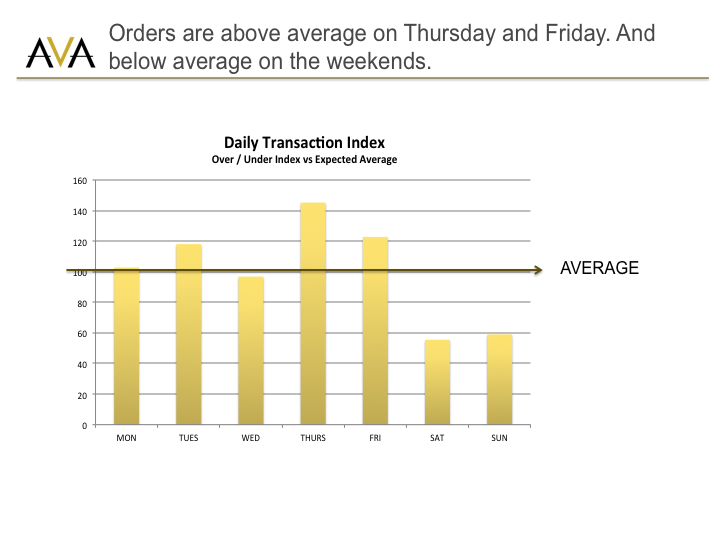
This chart is expressed as an index. How it works: we took the % of actual daily orders that occur on Mondays, Tuesdays, and so on, and divided this by the expected daily orders (in this case, 1/7 or 14%), and rebased that to 100. Therefore an index of 140 means that the actual orders on that day is 40% higher than the expected average.
The implication for e-commerce sites here is that it is probably not a good idea to spend on advertising during weekends when consumer predisposition to shop is low.
The interesting part which requires further investigation is why orders over-index on Thursdays and Fridays. One explanation is that online shopping fulfills a different need – it could be more of a stress reliever after a busy week.
Paydays do not significantly impact sales. One common belief is that consumers tend to shop more during paydays because they feel like they have a little bit more in their wallets.
To test whether this applies to online retail as well, we took 5 distinct payday periods from May to July. Each payday period is three days long because we assume that any ‘payday effect’ could be felt for three days. Then, we hypothesized that any payday effect would result in a 200 over-index vs the daily average # of orders (or twice vs the average).

We found no such over-index. In fact, with the exception of June 15-17, our data set showed no significant surge in payday shopping to warrant a conclusion that paydays affect sales.
There could be several reasons for this. One, people could be spending their money first on restaurants or bars with their friends/family. Or they could be shopping offline first before going online.
This of course has real business implications. Some sites run payday promotions when in fact, it could be an unnecessary cost (in terms of margin erosion) as consumers are not predisposed to spend significantly more during paydays.
The average cost to acquire each customer is around P550. This is a pretty straightforward calculation: divide total marketing spend by the number of NEW customers per month (not total customers as this will skew CAC and make it look artificially lower). I believe we can get this lower (to the P200-P300 levels), but because we target a very specific, premium audience, the costs would be higher. Theoretically, that should be okay as long as we attract customers whose gross profitability exceeds P550.
Based on our average transaction size (close to P4k) and margins, the average payback is 0.58x. That means each customer we’ve acquired online is already profitable on the 1st purchase. Anything after that is gravy. Which means this model is dependent on the # of repeat buyers.
This has a huge implication for brands. For the first time ever, Filipino fashion brands can target a well-defined segment online (via social or search ads), experiment with the right merchandising mix, and profitably acquire online shoppers that can make e-commerce a sustainable channel that is ROI-positive (vs print ads which you can’t track). No need to spend excessively on branches in the malls to compete with H&M; just be fast and smart in reaching customers online. This is one reason why Globe COO Peter Bithos announced that he will start exiting print and outdoor advertising and focus on digital ads.
Anyway, back to the data. So what’s repeat like?
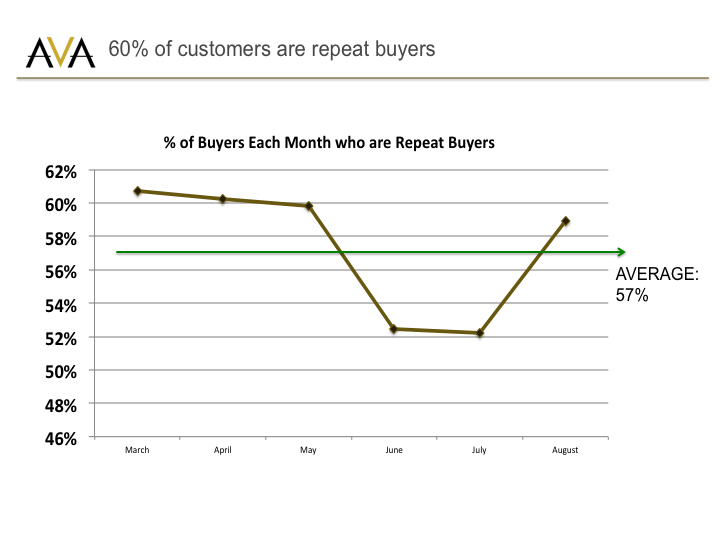
60% are repeat buyers. We think one reason for this is our focused approach on a particular segment. Another is our rewards program. 85% of our transactions result in consumers getting rewards points.
What about loyalty over time? For this analysis, we worked with Ben Rollert, former data scientist at Kickstart Ventures to identify the most profitable channels and devices.
What we did here is to map out the profitability of consumers who were acquired via our email newsletter vs Facebook vs Google, with their device usage (desktops vs tablets vs mobiles). What we found is that Google search on tablets produced the most profitable customers.

The implication here is that brands may opt to be more aggressive with their online advertising spend depending on how these numbers look like for their specific online stores. Recall that our customer acquisition cost is P550. And if Google search ads deliver us customers who are worth P1400 in gross profit, that means we can opt to spend (at least in the 1st 15 weeks) an additional P850 in that channel (P1400 minus P550) and still have profitable customers in a year’s time. Again, these numbers will look very different for your brand.
So there you have it! I hope the data above can help you formulate your own e-commerce strategy. This was just a super short overview fit for public consumption. If you’d like more data and help on building your online retail strategy and crafting digital marketing campaigns, feel free to drop me a note.


